SEGGER J-Link EDU Mini - JTAG/SWD Debugger: 3571
Doing some serious development on any ARM-based platform, and tired of 'printf' plus an LED to debug? A proper JTAG/SWD HW debugger can make debugging more of a pleasure and less of a pain. It allows you to program your devices at the click of a button, read or write memory addresses or registers on a live system, temporarily halt program execution at a given location or condition, and much more. Essentially, it's a direct window into what's going on inside your MCU at any given moment, giving you a level of access and control that's not easy to replicate with other debugging methods.
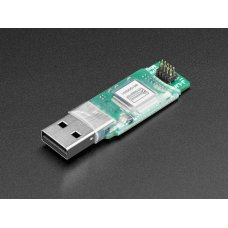
The J-LINK EDU Mini is a version of the J-Link EDU in a reduced form factor (18mm x 50mm – like a USB stick!) with identical functionality for Cortex-M based targets. We really love J-Links for programming our Cortex chips, they're durable and support every microcontroller we've bumped into. They're also often supported within the IDE's for chips for native debugging (e.g. Atmel Studio for when we're doing our ATSAMD development). The new Mini is bare-bones and very affordable! It is designed to allow students and educational facilities as well as hobbyists access to top of the line debug probe technology. It can do just about everything the 'big sister' J-Link EDU can do:
- Unlimited Breakpoints - The unlimited breakpoints in flash memory feature can be used free of charge for evaluation. The evaluation period is not time limited. For commercial use a separate license is required.
- Free Software Updates - As a legitimate owner of a SEGGER J-Link, you can always download the latest software free of charge. Though not planned and not likely, we reserve the right to change this policy. Note that older models may not be supported by newer versions of the software. Typically, we support older models with new software at least 3 years after end of life.
- Supports concurrent access to CPU by multiple applications - J-Link allows multiple applications to access a CPU at the same time. This has numerous applications. J-Link commander can be used in parallel to a debugger, a tool to communicate via DCC can be used in parallel to a debugger or a visualization tool such as Micrium's u/C-Probe or SEGGER's kernel viewer embOSView.
- Cross-platform support - Runs on Windows, Linux, Mac OS X. The MAC and Linux versions are fully usable, but limited to the following components: J-Link Commander, command line GDBServer, shared library (DLL-equivalent)
- Licensing and Support : J-Link EDU Mini may only be used for non-commercial purposes. J-Link EDU Mini does not include support. (However you may submit your question to the SEGGER Forum)
You may use the J-Link EDU for non profit educational purposes only! Non-profit educational purposes means that you may not use the J-Link EDU and its J-Link software.
- direct or indirect in or for a profit organization or business purposes or other undertaking intended for profit
- direct or indirect in any other commercial environment (e.g. office)
- to develop, debug, program or manufacturer a commercial product (or parts thereof)
- to use it to either earn money or reasonably anticipate the receipt of monetary gain from it.
What does this mean? Basically, if you're making money (or plan to make money) off your project, you'll need to order the full commercial version, or find a different debugger that suits your needs and budget better. But if you're working on personal, non-commercial projects, such as publishing some open source designs you're not selling yourself, you're good. You don't need to be a student, and you can even be a paid engineer during the week, using this on the weekend for personal non-commercial projects. As long are your intentions are non-commercial, the J-Link EDU is an excellent choice!
This kit comes with a 20-pin (2x10) 0.1" cable and a 10-pin (2x5) 0.05" cable.
More about why we like J-Link!
- Of the dozens (and dozens!) of debuggers out there (we have literally drawers full of them!), we chose the J-Link for a number of reasons:
- It's USB based and uses a high-speed MCU internally, not an FTDI convertor like most low cost debugger. More debugging, less waiting!
- It's toolchain, IDE and vendor neutral, so you only need to buy one tool for all of your ARM needs and be done with it forever:
- Support GDB-based debugging and flash programming on Linux, Windows and the Mac via the free GDB Server
- Supports most major IDEs, including Keil, IAR Atmel Studio, Crossworks for ARM
- It includes flash-programming algorithms for most MCUs, and Segger is very pro-active about updating their drivers to support the newest chipsets.
- It just works, and keeps on working, and it'll be there for you in several years time.
The J-Link is fast. Stepping through breakpoints and reading memory addresses is quick, as is programming the flash memory on the chips. Its real strength, though, is that it's so vendor and tool neutral. Most chip vendors today provde low cost (or free) tools, but they also lock you into their chips and force you to accept the choice they've made for you. Segger's J-Link is a nice change in that respect, since you can be reasonably certain it will work with any chip, in any major toolchain, and you're free to change camp (or OS or IDE) without having to buy a new debugger every time.
Why Would I Want This?
You can do a lot of basic debugging with just printf and an LED, and you may not need a HW debugger to get started, but once you start to working on more complicated projects, you hit a debugging wall pretty quickly.
- Your chip might be ending up in the HardFault handler, for example, but without a debugger it can be very hard to trace back exactly what is causing the problems. A debugger allows you to set 'breakpoints' in your code, where execution will temporarily stop, and you can check the value of memory or peripherals at that point in time, and then 'single-step' through your code line by line, executing your program until you find the place that causes your fault. There's a lot more to debugging than simple breakpoints, but you can often solve in a few minutes with breakpoints what would take much longer with printf and instrusive blocking mechanisms you insert into your code without a debugger.
- Whether you're using GDB Server (GNU Tools) or an IDE and a commercial toolchain, it's also just a big convenience, since the J-Link can program the flash for you at the click of a button, reset the device, start execution, and then 'halt' on main(). You can do all these steps yourself -- programming the device via free tools over UART or via a USB bootloader, etc. -- but when you need to do that 40-50 times a day, it can get old quick, and 15 seconds saved make a huge difference when debugging. You can program a small MCU and break on main in 2-3 seconds with a J-Link, which makes the tools more or less invisible, which is a good thing when you have other problems to worry about.
Specifications:
- J-Link EDU Mini is delivered with the following components:
- J-Link EDU Mini with standard 10-pin 0.05" male connector (compatible to J-Link)
- 20-pin, 0.1" target ribbon cable
- 10-pin, 0.05" target ribbon cable
- USB-A to USB Micro-B cable
- Debugger weight: 4.8g
- Debugger dimensions: 35.6mm x 17.25mm x 7.5mm
- Cable length: 6"
- For product support for all Segger products, click here!
SEGGER J-Link BASE - JTAG/SWD Debugger: 2209
- If you're going to use your debugger strictly for personal, non-commercial projects, such as publishing open source designs that you're not selling, then you should get the EDU version! It's the same but significantly cheaper.
- On the other hand if you're making money, or plan to make money off your project, then you're in the right place with the SEGGER J-Link BASE - JTAG/SWD Debugger. This is the best JTAG/SWD programmer/debugger, you will thank yourself for investing in this industry-standard tool!
Doing some serious development on any ARM-based platform, and tired of 'printf' plus an LED to debug?
A proper JTAG/SWD HW debugger can make debugging more of a pleasure and less of a pain. It allows you to program your devices at the click of a button, read or write memory addresses or registers on a live system, temporarily halt program execution at a given location or condition, and much more. Essentially, it's a direct window into what's going on inside your MCU at any given moment, giving you a level of access and control that's not easy to replicate with other debugging methods.
Of the dozens (and dozens!) of debuggers out there (we have literally drawers full of them!), we chose the J-Link for a number of reasons:
- It's USB based and uses a high-speed MCU internally, not an FTDI convertor like most low cost debugger. More debugging, less waiting!
- It support both JTAG (ARM7/9/11) and SWD (ARM Cortex), and has you covered for any core: ARM7/9/11, Cortex-A5/A8/A9, Cortex-M0/M0+/M1/M3/M4, Cortex-R4
- It's toolchain, IDE and vendor neutral, so you only need to buy one tool for all of your ARM needs and be done with it forever:
- Support GDB-based debugging and flash programming on Linux, Windows and the Mac via the free GDB Server
- Supports most major IDEs, including Keil, IAR Atmel Studio, Crossworks for ARM
- It includes flash-programming algorithms for most MCUs, and Segger is very pro-active about updating their drivers to support the newest chipsets.
- It just works, and keeps on working, and it'll be there for you in several years time.
The J-Link is fast. Stepping through breakpoints and reading memory addresses is quick, as is programming the flash memory on the chips. It's real strength, though, is that it's so vendor and tool neutral. Most chip vendors today provde low cost (or free) tools, but they also lock you into their chips and force you to accept the choice they've made for you. Segger's J-Link is a nice change in that respect, since you can be reasonably certain it will work with any chip, in any major toolchain, and you're free to change camp (or OS or IDE) without having to buy a new debugger every time.
Why Would I Want This?
You can do a lot of basic debugging with just printf and an LED, and you may not need a HW debugger to get started, but once you start to working on more complicated projects, you hit a debugging wall pretty quickly.
- Your chip might be ending up in the HardFault handler, for example, but without a debugger it can be very hard to trace back exactly what is causing the problems. A debugger allows you to set 'breakpoints' in your code, where execution will temporarily stop, and you can check the value of memory or peripherals at that point in time, and then 'single-step' through your code line by line, executing your program until you find the place that causes your fault. There's a lot more to debugging than simple breakpoints, but you can often solve in a few minutes with breakpoints what would take much longer with printf and instrusive blocking mechanisms you insert into your code without a debugger.
- Whether you're using GDB Server (GNU Tools) or an IDE and a commercial toolchain, it's also just a big convenience, since the J-Link can program the flash for you at the click of a button, reset the device, start execution, and then 'halt' on main(). You can do all these steps yourself -- programming the device via free tools over UART or via a USB bootloader, etc. -- but when you need to do that 40-50 times a day, it can get old quick, and 15 seconds saved make a huge difference when debugging. You can program a small MCU and break on main in 2-3 seconds with a J-Link, which makes the tools more or less invisible, which is a good thing when you have other problems to worry about.
Specifications:
- J-Link BASE is delivered with the following components:
- J-Link BASE with standard 20-pin 0.1" male connector (compatible to J-Link)
- 20-pin, 0.1" target ribbon cable
- USB cable
- 102mm x 53mm x 27mm / 4" x 2.1" x 1.1"
- Weight: 66g
Features:
- Direct download into flash memory of most popular microcontrollers supported
- Supported CPUs: Any ARM7/9/11, Cortex-A5/A8/A9, Cortex-M0/M1/M3/M4/M7, Cortex-R4, Microchip PIC32 and Renesas RX100/RX200/RX610/RX621/RX62N/RX62T/RX630/RX631/RX63N
- Download speed up to 1 MByte/second
- Supports unlimited breakpoints in flash memory! More info...
- Setting breakpoints in external flash memory of Cortex-M systems is possible with
- J-Link's Unlimited Flash Breakpoints technology only!
- Supported by all major IDEs More info...
- Free software updates, 1 year of support
- Supports concurrent access to CPU by multiple applications
- Crossplatform support (runs on Windows, Linux, Mac OS X)
- Intelligence in the emulator firmware More info...
- Remote Server included. Allows using J-Link remotely via TCP/IP More info...
- GDBServer included More info...
- Production flash programming software (J-Flash) available More info...
- Software Developer Kit (SDK) available More info...
- Supports multiple target interfaces: JTAG, SWD
- Supports SWV/SWO (Serial Wire Viewer / Serial wire output)
- Wide target voltage range: 1.2V - 3.3V, 5V tolerant
- Supports JTAG chains with multiple devices
- Embedded Trace Buffer (ETB) support
- Various target adapters available, including optical isolation adapter. More info...
- RDI / RDDI interface DLL available. More info...
- Fully plug and play compatible
- No power supply required, powered through USB
- Support for adaptive clocking
- All JTAG signals can be monitored, target voltage can be measured
- Target power supply: J-Link can supply up to 300 mA to target with overload protection
Documentations:
Adafruit 3571 / 2209 SEGGER J-Link EDU/ Mini/ Base - JTAG/SWD Debugger
- Brand: Adafruit
- Product Code: Ada-SEGGER-J-Link-EDU
- Reward Points: 85
- Availability: In Stock
-
रo 8,085.00
- Price in reward points: 8530
-
- 15 or more रo 8,055.00
Available Options
Related Products
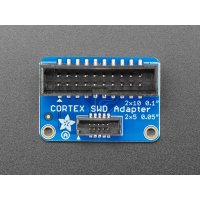
Adafruit 2094 JTAG (2x10 2.54mm) to SWD (2x5 1.27mm) Cable Adapter Board
This adapter board is designed for adapting a 'classic' 2x10 (0.1"/2.54mm pitch) JTAG cable to a sli..
रo 534.00
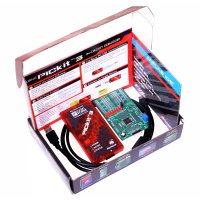
PICkit 3 Debug Express
The PICkit 3 allows debugging and programming of PIC(R) and dsPIC(R) Flash microcontrollers using th..
रo 3,243.00
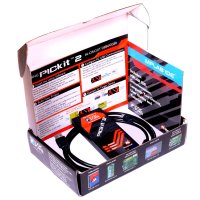
PICkit 2 Programmer/Debugger
The PICkit2 Development Programmer/Debugger (LPPK2-PG164120) is a low-cost development tool with an ..
रo 1,702.00
Pine64 SWD DEBUGGER
SWD Debugger for PADI IoT Stamp. Generic SWD (Serial Wire Debugger) module for ARM Cortex device..
रo 1,141.00
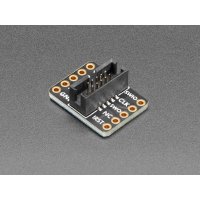
Adafruit 2743 SWD (2x5 1.27mm) Cable Breakout Board
This adapter board is designed to make it easier to use ARM dev boards that use slimmer 2x5 (0.05"/1..
रo 318.00
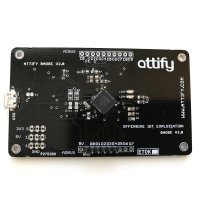
Attify Badge - UART, JTAG, SPI, I2C
Attify badge is a hardware tool that allows you to interact with various hardware interfaces and por..
रo 7,399.00
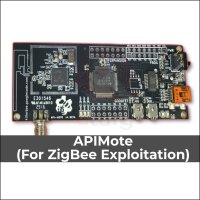
APIMote (for ZigBee Sniffing and Transmission)
The ApiMote is a ZigBee security research hardware intended for researchers, students, utility compa..
रo 21,080.00
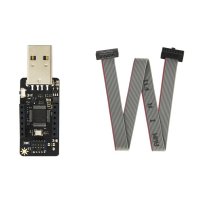
Particle Debugger
The Particle Debugger gives you the power of professional debugging at a fraction of the cost. Using..
रo 2,140.00
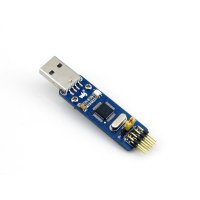
Waveshare 10053 ST-LINK/V2 (mini), STM Programmers & Debuggers
Mini ST-LINK/V2, In-Circuit Debugger/Programmer For STM8 And STM32.Mini ST-LINK/V2 on a small single..
रo 864.00 रo 1,030.00



-200x200.jpg)
